Gain deeper insights and spot opportunities faster with
Everest Trading Technology’s powerful Visualization suite, featuring interactive Heat Maps and Surface tools.
HeatMap
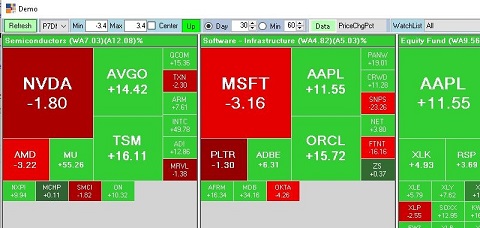
Turn market movers into actionable insight with Everest Trading Technology’s Heatmap tool. Instantly spot leaders and laggards with real-time color cues, then drill into symbols or sectors for patterns. Customize groupings and metrics, filter by timeframe or watchlist, and map colors to price, volume, or volatility. With intuitive controls and rapid updates, the Heatmap delivers exactly the data you need—right when you need it.
Surface Tool
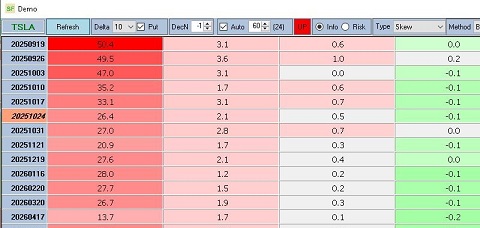
Everest Trading Technology’s Surface Tool gives traders a fast, flexible view of positions or market-wide activity across configurable delta ranges and expirations. Quickly uncover risk concentration, monitor expiring positions, and see where gamma will spike—so you can roll, trim, or hedge proactively. Toggle between portfolio and market modes to visualize open interest and volume by delta bucket and expiration, revealing where the trading is happening.
Analysis & Execution
Our Option Viewer and Order Manager deliver lightning-fast, low-cost execution with proprietary algorithms to ensure orders are filled quickly at the best available price and lowest cost. Track positions, Greeks, and market conditions in a single intuitive dashboard — no switching screens required.
Explore Analysis & Execution →
Risk Management
Effectively manage risk with deep visibility across the firm’s book and day trades, analyze PnL, set granular risk limits, and identify threshold violations and pin risk. Execute end-of-day hedging quickly with Stock Hedger.
View Risk Management Tools →
Research & Idea Generation
Build FairVol and event-move models, and scan markets in real time to instantly identify opportunities with a powerful, customizable toolset—no coding required.
Discover Research Ideas →
Charting & Fundamentals
Spot trends with flexible intraday and historical charts, and access comprehensive fundamentals with Stock Analyzer.
See Charting Tools →
Visualization
Visualize exposures, correlations, and scenario outcomes with intuitive, interactive views provided by our HeatMap and Surface Tools.
Try Visualization →
API
Integrate Everest’s tools with your systems via our API options for seamless automation.
Learn About Our API →
Contact Us
Contact us today to request a free trial or learn more about the Everest Trading Technology platform's features and advantages.